Example 1 - TCGA
Figure 1 in the application note manuscript contains a heatmap demonstrating performance of predictors over all possible views of The Cancer Genome Atlas (TCGA) (Weinstein 2013). The public TCGA dataset contains methylation, miRNA, mRNA and RPPA profiles and metadata for tumor samples spanning a range of clinical tumor types. A variety of metadata is also present such as the age of the donor, then, smoking status and time until patient death (if applicable) from when the sample was taken. The TCGA packaged dataset as present in Phenonaut uses the same preparative steps as taken by Lee (Lee 2021), whereby the dataset was downloaded, rows with missing data removed and then principal component dimensionality reduction used to reduce the feature space within each view to 100 features. In addition to those preparative steps carried out by Lee, an additional metadata column is derived from the “days_to_death” column, indicating if the tumor donor survives 1 year after the sample was taken and named ‘survives_1_year’. Code used direct Phenonaut in production of the performance heatmap is available within the GitHub repository with the name “example1_TCGA.py”. This was executed in a Python 3.9.5 environment using Phenonaut version 1.0.0, Numpy version 1.20.3, Pandas version 1.4.0, scikit-learn version 0.24.2, and PyTorch version 1.10.2. Whilst the full source of example1_TCGA.py is considerably longer and more verbose than the code used to exemplify the task in Figure 1, additional checks on command line parameters and use of the fire interface module are not required. The minimal Python code listing given in Figure 1, along with the workflow YAML file are both sufficient to produce the reported output. Within Phenonaut, the predict submodule contains a profile function with purpose of applying all suitable predictors (classifiers, regressors, or multiregressors) to all possible view combinations for a given prediction target. The profile function performs the following:
The data within the prediction target is examined and the prediction type determined from classification, regression, and multiregression/view prediction (prediction of 1 omics view from another). In the case of Example 1, on TCGA, with the prediction target of “survives_1_year”, the data types within the metadata are examined and only two values found 0 (no) or 1 (yes). Classification is chosen.
With no classifiers explicitly given as arguments to the profile function, Phenonaut selects all default classifiers. User supplied classifiers and predictors may be passed, including PyTorch neural networks and similar objects implementing fit and predict methods. See API documentation for further information on including user defined and packaged predictors.
With no views explicitly listed, all possible view combinations are selected. For TCGA, the four omics views allow 15 view combinations (4x singular, 6x double, 4x triple and 1x quad).
For each unique view combination and predictor, perform the following:
Merge views and remove samples which do not have features across currently needed views.
Shuffle the samples.
Withhold 20% of the data as a ‘test’ set, to be tested against the trained and hyperparameter optimised predictor.
Split the data using 5-fold cross validation into train and validation sets.
For each fold, perform Optuna hyperparameter optimisation for the given predictor using the train sets, using hyperparameters described by the default predictors for classification, regression and multiregression (see API documentation for further information).
Optimized models are then evaluated with the held-out test set and standard deviations calculated from validation sets.
Writing output from the profiling process consisting of performance heatmaps highlighting best view/predictor combinations in bold, boxplots for each view combination and a PPTX presentation file allowing easy sharing of data, along with machine readable CSV and JSON results.
Reference:
Weinstein, John N., et al. “The cancer genome atlas pan-cancer analysis project.” Nature genetics 45.10 (2013): 1113-1120. Lee, Changhee, and Mihaela van der Schaar. “A variational information bottleneck approach to multi-omics data integration.” International Conference on Artificial Intelligence and Statistics. PMLR, 2021.
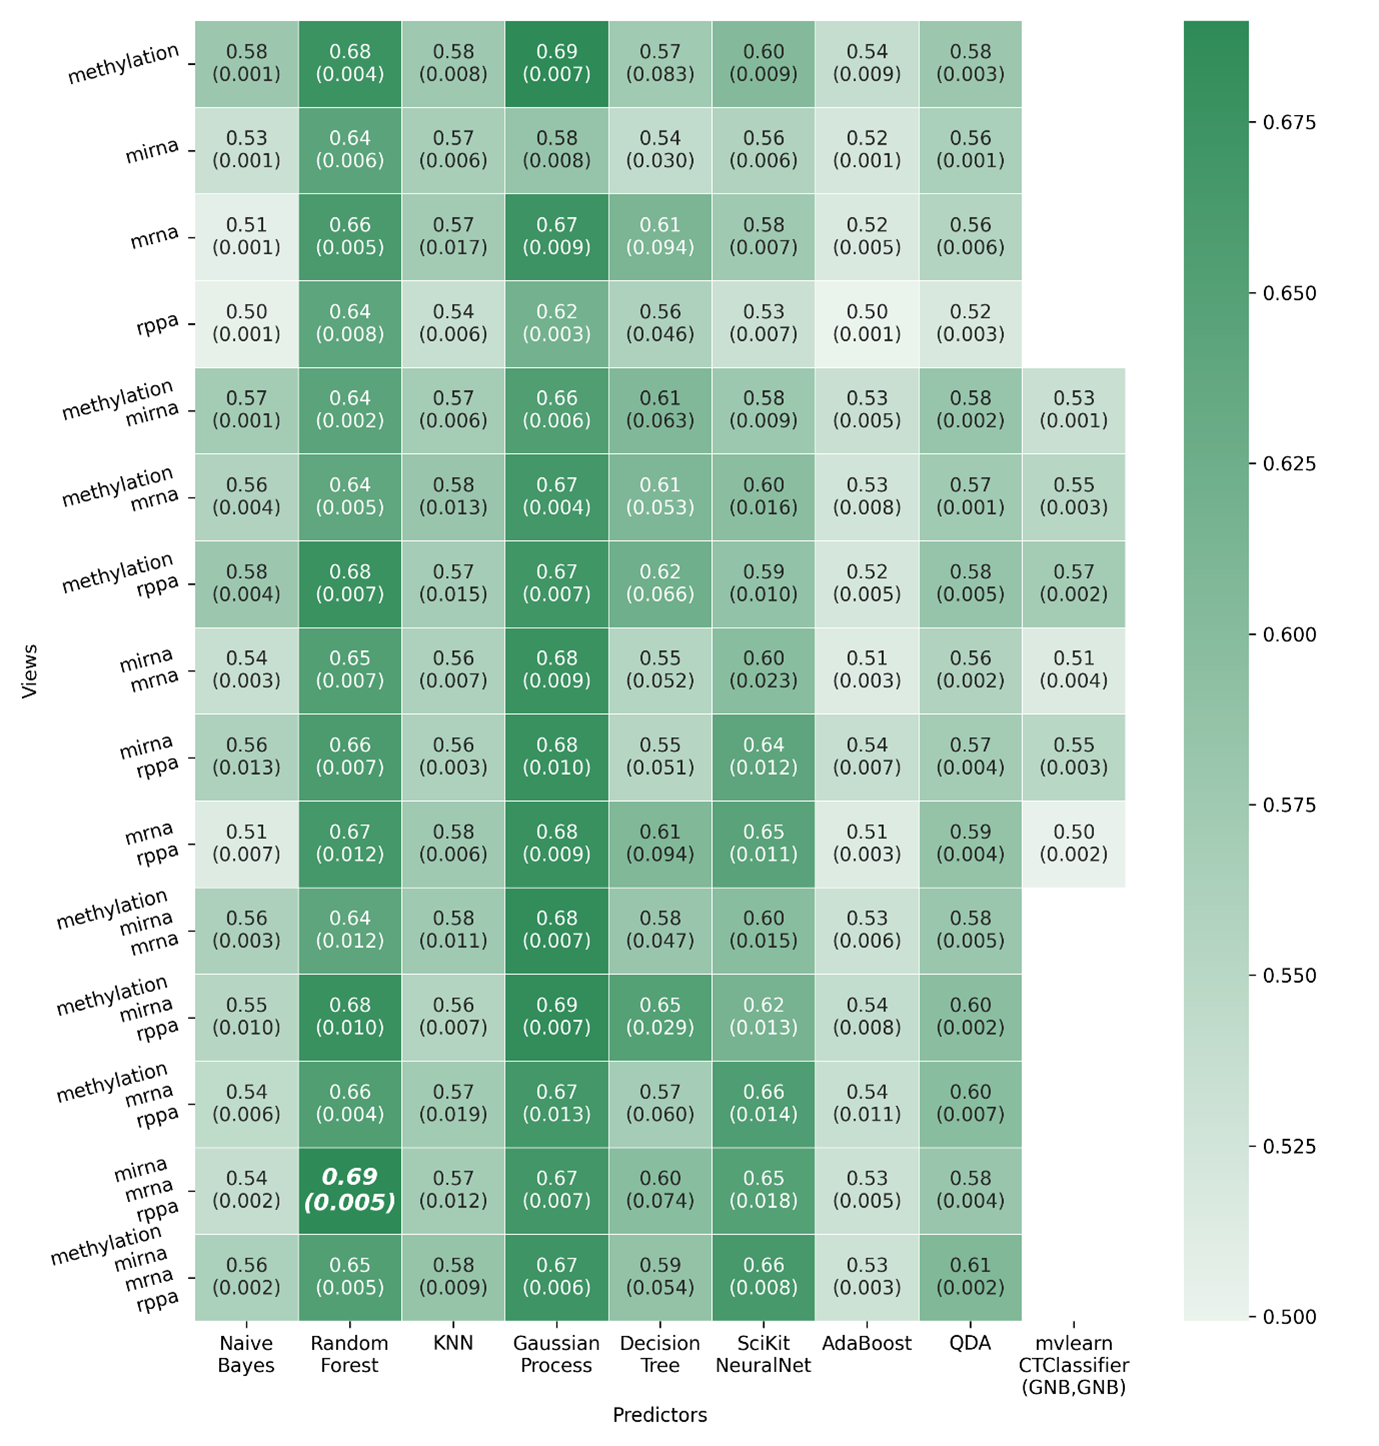
Figure 1. Predictor-view performance heatmap showing AUROC scores, generated by calling the predict.profile function on the TCGA packaged dataset, predicting 1 year survival rates of tumor donors. Train, validation, test splitting is used, along with the Optuna hyperparameter optimisation library to optimise all given predictors, across all possible view combinations. The best scoring predictor on the best combination of views is shown in bold (miRNA, mRNA and RPPA) using a random forest predictor.
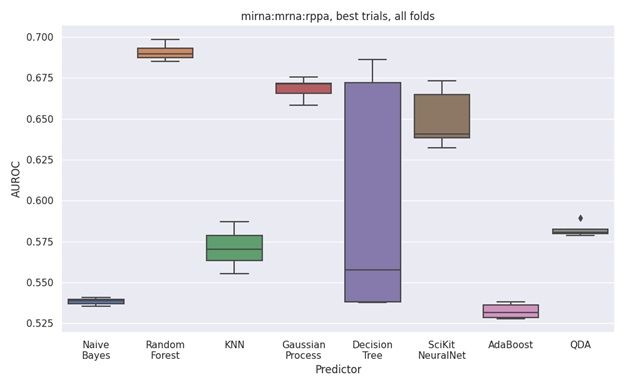
Figure 2. Boxplot performance heatmap of all validation folds across the best view; miRNA, mRNA and RPPA, as determined by test set.
In addition to the “best view” performance boxplot shown in Figure 2, boxplots across all views are output as PNGS, and included into a summative PPTX presentation file along with the overall performance heatmap shown in Figure 1, and machine readable performance measures in the CSV and JSON file formats.
Code listing
Python
import fire
from phenonaut import Phenonaut, predict, packaged_datasets


def run_phenonaut_tcga(
    output_path: str,
    tcga_path: str = "/local_scratch/data/phenonaut_datasets/tcga",
    n_optuna_trials: int = 20,
    run_predictors: bool = True,
    optuna_merge_folds: bool = False,
):
    """Run TCGA example, predicting one year survival rate over a range of datasets and combinations

    Parameters
    ----------
    output_path : Union[str, Path]
        Output directory for the results of phenonaut.predict.profile
    tcga_path : str, optional
        The location of the TCGA dataset if already downloaded, otherwise, the destination location, by default "/local_scratch/data/phenonaut_datasets/tcga"
    n_optuna_trials : int
        Number of optuna_trials to run for each predictor and each view, by default 20
    run_predictors : bool, optional
        If True, then run all predictors, by default True
    optuna_merge_folds : bool, optional
        By default, every fold of the train-validation split is optimised by optuna for a predictor&view pair.
        If optuna_merge_folds is true, then the average validation score of each fold is passed as the result
        to optuna, optimising models across all folds. , by default False.
    """
    phe = Phenonaut(dataset=packaged_datasets.TCGA(root=tcga_path, prediction_target="survives_1_year"))
    predict.profile(
        phe,
        output_path,
        metric="AUROC",
        n_optuna_trials=n_optuna_trials,
        predictors=None if run_predictors else [],
        optuna_merge_folds=optuna_merge_folds,
    )


if __name__ == "__main__":
    fire.Fire(
        run_phenonaut_tcga,
    )
YAML
---
Example_1_predict_survival:
- load:
    dataset: TCGA
- predict:
    target: survives_1_yr